How to Use Amazon Best Sellers Ranks

A lot of items on Amazon have what is called a “Best Sellers Rank” (BSR for short), but what is it, and how can you use it?
What is a Best Sellers Rank (BSR)?
In short, the BSR is how well an item sells based on the category it is in. A rank of 1,000 means that an item sells much more often than a rank of 25,000. It is not perfect measure by any means, but a rank of 1 means that is the best selling item in that category. But not all products have a BSR, and if they do not have one then that is a good sign that the item does not sell very often (or at all). You can usually find the BSR in the “Product Information” section of an item.
BSR Categories & Subcategories
But sometimes there are multiple ranks, so which rank do you use? Generally you only want to use the primary, or top level category rank as a measure of that items success. In the example above Toys & Games is the top level category, while Arts & Crafts > Drawing & Painting Supplies > Coloring Pens & Markers is the subcategory. Well, technically Coloring Pens & Markers is a subcategory of Painting Supplies, which is a subcategory of… You get the picture. The takeaway here is that if you are estimating item sales you want to use #9 in Toys & Games and ignore the #1 in Toys & Games > Arts & Crafts. If come across an item that only lists a rank as a hierarchy, assume that it does not sell well enough to be ranked in the primary category.
Using the BSR
Now that you have an understanding of what a BSR is, now it is time to put it to use. Since most items have a rank, all we need is to know how many items are in that category and we can get an idea about how well it sells. Thankfully there is a Best Sellers Rank Chart right here on flipamzn that you can reference. If you look at that chart you will see that there are nearly 5.4 million toys listed in the Toys & Games category. While each category is different and has its own nuances, as general rule of thumb you want to try and stay within the top 1-2% of category to have consistent sales. For Toys & Games this would be items ranked below 54,000 or 108,000. Personally I try to stay in the top 1% expect during Q4.
Other Resources for BSRs
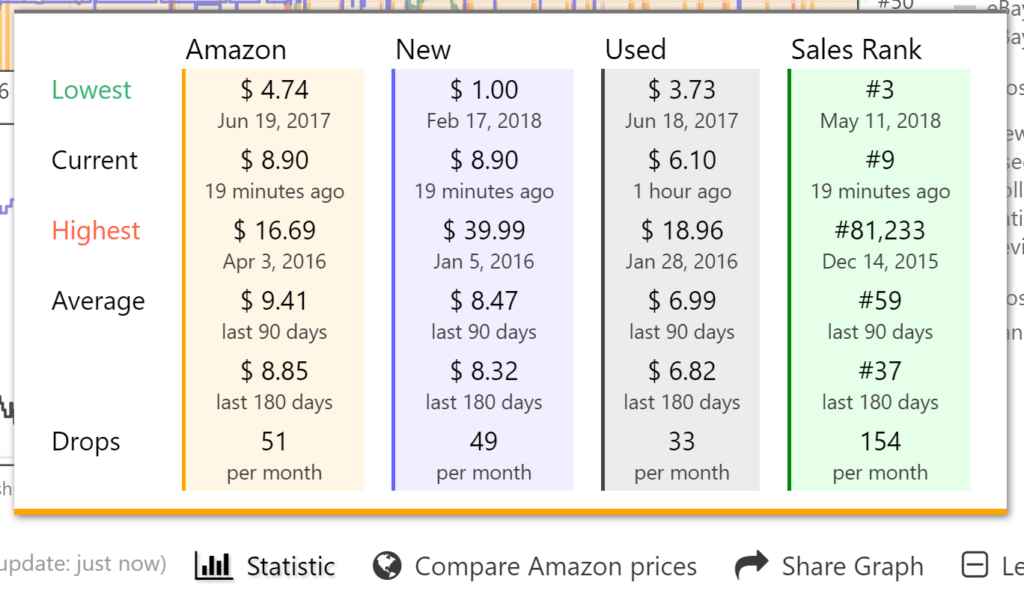
There are a few other things you should know before you go. The first is that ranks change if an item sells more or less. Some seasonal items will completely fall off the map for the majority of the year, but will be ranked in the low thousands during their prime time. To make sure that an item does not just have a decent rank at the moment, we turn to the Keepa Extension. Not only does it show a helpful graph of the rank over time, but it also shows averages. Just hover over the “Statistic” section and you can see the Lowest, Highest, and Average rank of an item over time.
Keepa is an extremely useful (and free) tool that you should take advantage of as soon as possible. But it is not the only free tool you should use. The other free tool is the Jungle Scout Rank Estimator. Just enter the rank, marketplace, and category to get an estimate of how many sales happen monthly. In the example below we used 25,000 in Toys & Games in the US and it estimates that this item sells 150 times per month.
Go get Sales!
Now that you have a solid understand of what BSRs are, and how they work, it is time to get out there and get some sales. But before you go, let us know in the comments below if this little guide was useful, or if you have any questions about it.