How to Read a Keepa Chart in 2019
In case you didn’t know, Keepa is a must have tool for Amazon sellers. Why? Because it tracks a ton of information about Amazon items, and then displays that information right on the Amazon product page for you to evaluate at a glance. If you don’t already have the Keepa Extension, you should go add it to Chrome right now.
Keepa Basics
Reading a Keepa chart can be pretty simple, but there can also be A LOT of information at your fingertips. But for now, let’s start simple. The left side of the graph is price ranges, the right side is sales rank ranges, and on the bottom is the date range. The majority of the information lines up to this ranges, and the most important are:
- Green Line – Sales Rank or Best Sellers Rank
- Blue Line – Lowest new price
- Yellow Blocks – Amazon in stock status
- Pink Diamonds – Buy Box price
- Orange Triangles – 3rd Party FBA lowest price
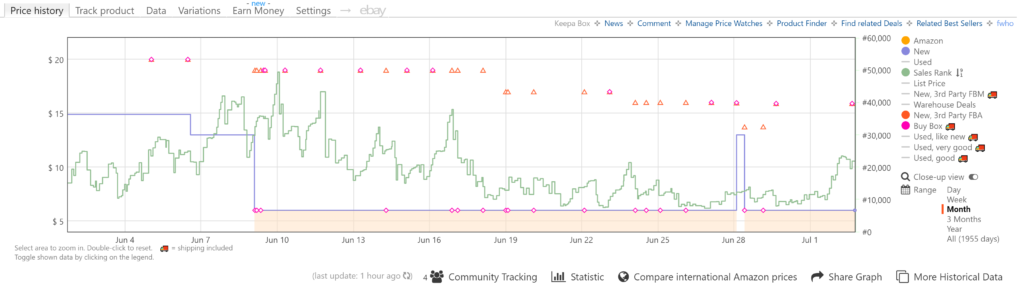
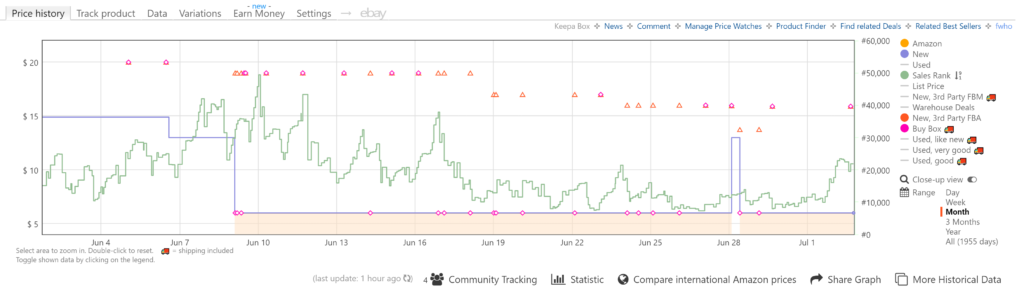
Looking at the example graph above we can determine a lot of things really quickly. First, the sales rank (green line) floated between 11,000 and 42,000 when Amazon was out of stock. Which is a decent range since this is in Toys & Games. Then around the 9th, Amazon came back in stock (yellow block) for the rest of the month, and the rank seems to stay between 10,000 and 20,000 during this time.
We can also see that the lowest new price (blue line) was between $13 and $15 until Amazon came back in stock at $6. But there is a lot more to this story as well! Because even when Amazon was in stock at $6, there were quite a few times that the buy box (pink diamonds) was $15. Weird right? Normally Amazon favors the lowest price for the buy box, and almost always favors themselves over 3rd party sellers. So why was the buy box $15 when Amazon was listed for $6? Because Amazon was on back order and couldn’t ship the item right away but the 3rd party sellers could. You’ll also notice that the 3rd party lowest price (orange triangles) line up with the buy box at those times.
At a quick glance we can determine a lot of things from this basic information. Even when Amazon is out of stock, this item continues to sell. The going price stays around $15, and even when Amazon is “in stock” they are giving the buy box to 3P sellers because they are typically on back order status. Whew, that was a lot.
Keepa Intermediate
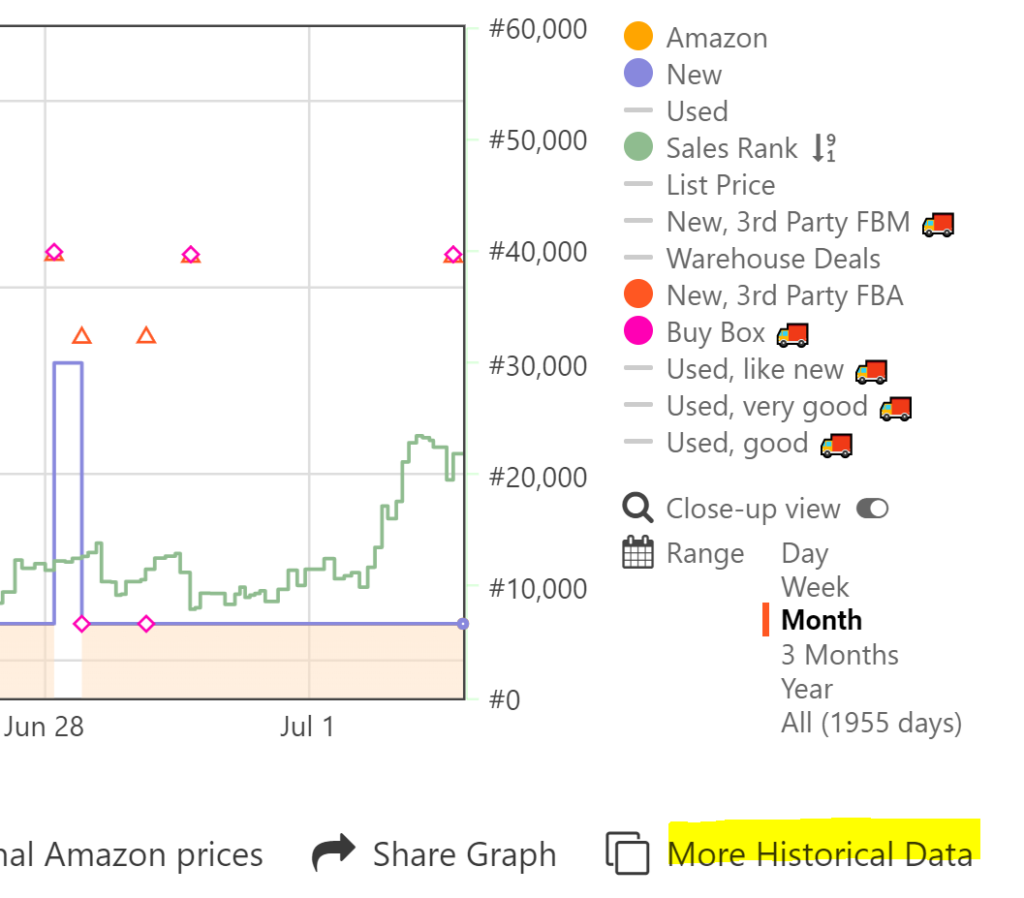
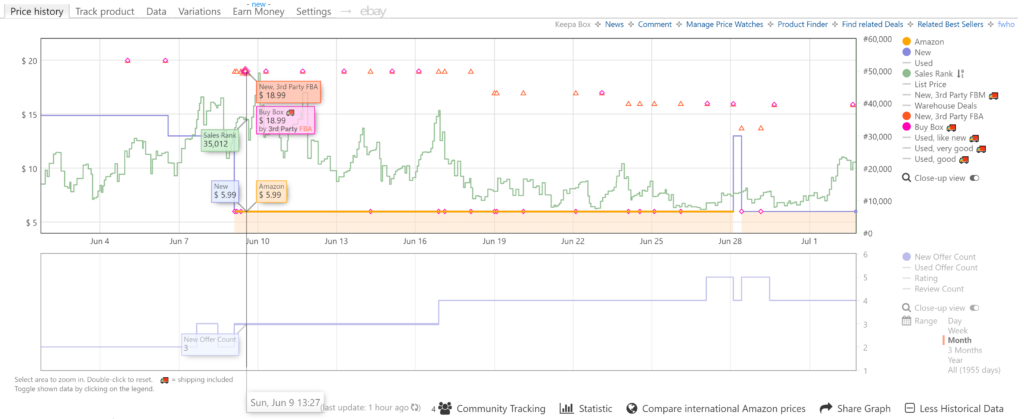
But wait, there’s more! Because on the side and bottom of the graph there is even more information that you can toggle. Most of it is pretty self-explanatory so we are going to talk specifically about the “More Historical Data”. Clicking this opens a second graph with information about the number of offers, reviews, and rating. Everything has a time and place, but today we are going to focus on the number of offers.
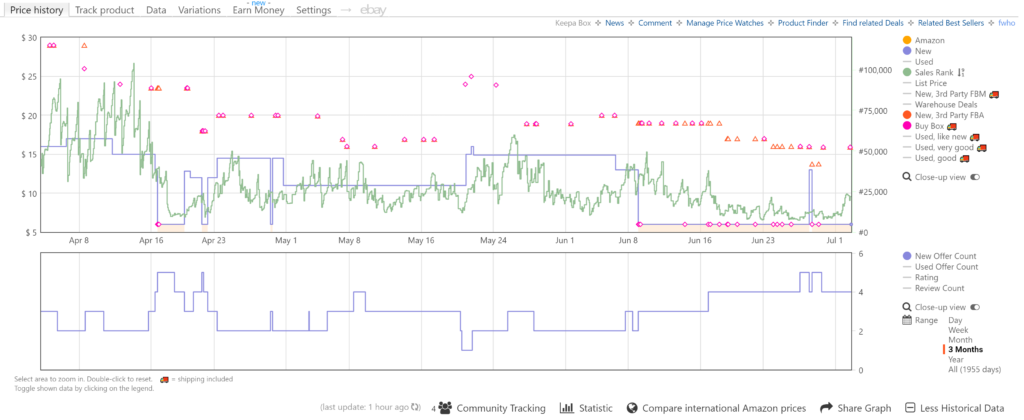
As you can see in the example above, the blue line on the second chart will show you how many different offers this product has across the selected timeline. This can be really useful information to help you gauge a products popularity and its potential to make money. If there are consistently 50 sellers on a product, you can almost bet there will be an endless price war.
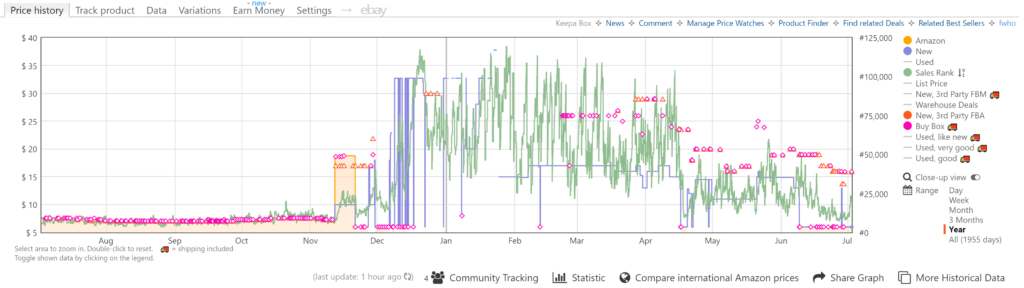
Another important thing to note is the time range that you are looking at. On the bottom right (near the historical data toggle) there are options to switch the chart time frame between week, month, three months, year, all time, and more. Check out the examples below, and make sure you flip through time frames to see the history of the item. Especially if you are looking at seasonal or holiday specific products.

There is still one more thing we need to cover in this section though, and that is the hover capabilities. Because when you hover over a specific area of the chart, Keepa highlights the data for that time and creates tool tip flags to give you an easy to read data points. Looking at the example below, you can clearly and easily see the prices (Amazon, new, 3P new, buy box), the rank, the number of offers, and even the date / time at the bottom.
Keepa Advanced
Finally, there are few more (slightly more advanced) features and data that you should know about. At the bottom of the chart – near the historical data, you also have how many people are tracking this item and some more textual statistics about the product itself. At the top you can also set price tracking to get alerts for items, see more advanced data, and even find variation information (if the product has variations).
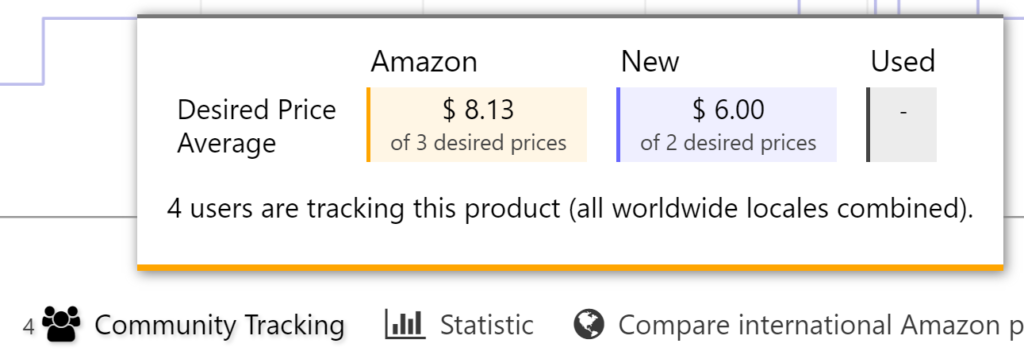
Above is what you will see when you hover over community tracking. This is especially useful if you know an item will make a good Amazon-to-Amazon flip and goes on sale. For example, if this product showed Amazon dropping their price to $1.99, we might set an alert for $2.00 so we can buy them to resell when Amazon has a sale. The amount of people tracking the item can sometimes also offer insight to if a product is a good flip or not. Obviously if 100 people are tracking an item it is much more likely to be a good flip than if only 4 people are tracking it.
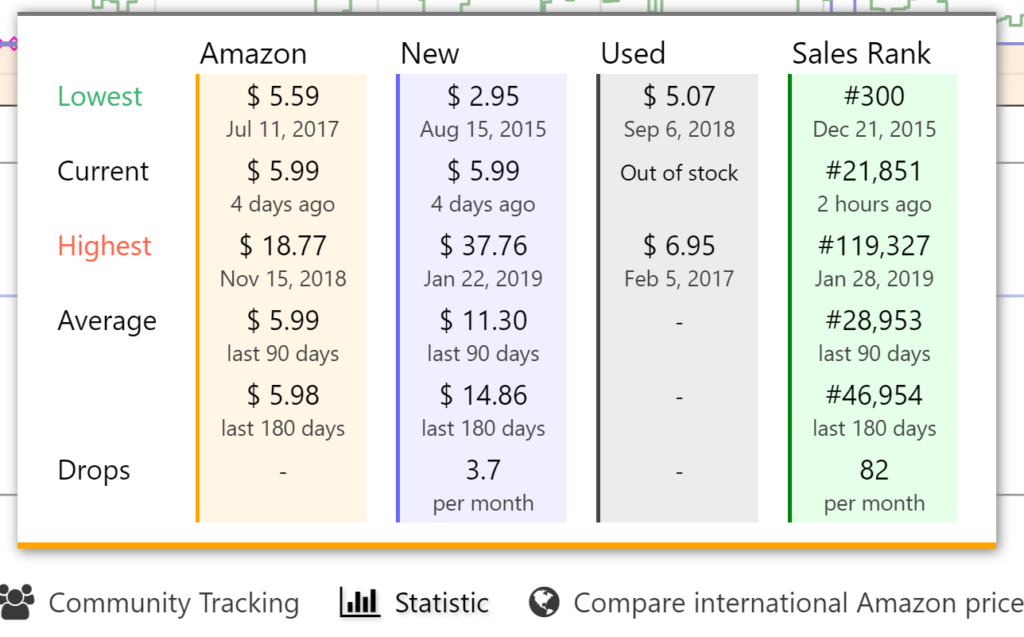
Beside the tracking option is the statistic option. This is also really useful for seeing a lot of information in one shot, and in text form. As you can see above, the statistics show you the lowest, current, highest, and 90 day average for Amazon price, new and used price, and even the ranks (with timestamps for when it reached the milestone).
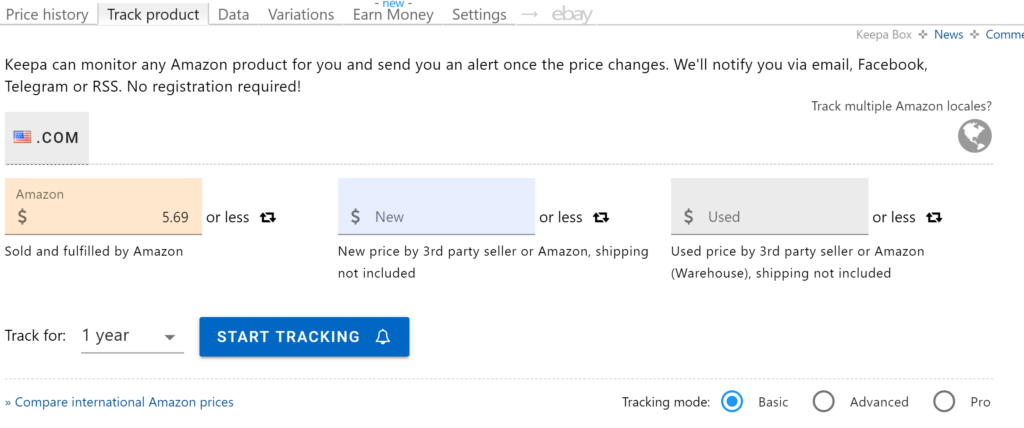
Now, one of the most useful features of Keepa – product tracking! If you do want to flip an item from Amazon-to-Amazon, you can quickly and easily set the tracking by clicking the “Track Product” tab at the top. Then you can choose what prices you are tracking, and for which seller and condition (or all of them). You can set tracking for $2.00 only if Amazon is the seller (yellow box), or you can set the same tracking for any new offer in the blue box. Finally, you can also set tracking for used items in the grey box – which is useful for text books and other potential flips. Then, as soon as the item and conditions meet the price you set, you will get an email and a Chrome notification that the item is in stock at your desired price.
The End
That’s all there is for Keepa for this post, but there is A LOT more we could cover. If you found this post useful, or have any questions about how to use Keepa make sure you post them below.
2 Responses
On the bottom, sometimes it shows a graph for the parent Asin. Is there a way to view the variation in hand?
My honest answer is that I am not sure. From the basic interface, no. The Keepa API (which way out of scope for this blog post) does provide different rank data than the parent. However, the parent items rank most likely “pulls” the variation as the parent item sells.